

Eurostat
European Union statistics, indicators and country comparisons.
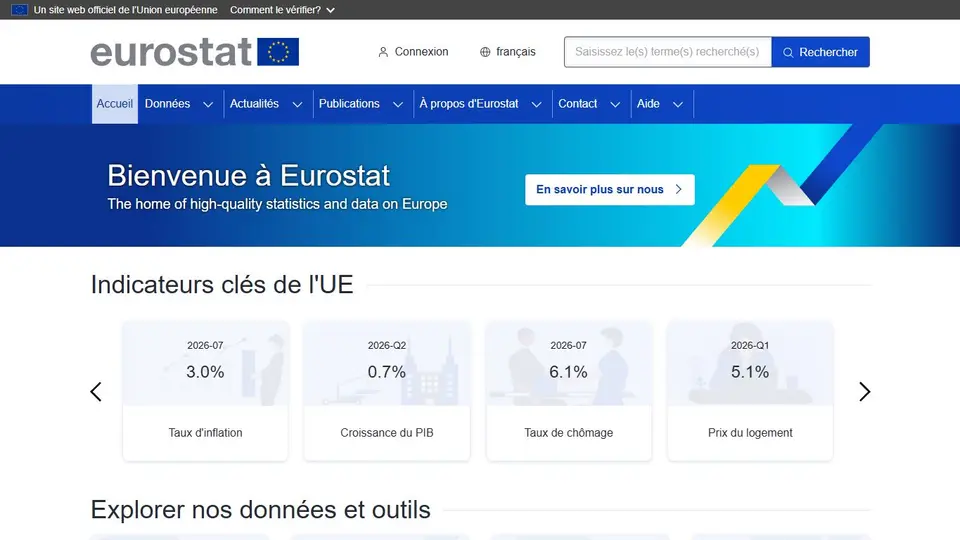
Screenshot captured on an unrecorded date. The current website may have changed.
Compare European countries
Find a harmonised indicator and its statistical definition.
Check first: Check unit, year and coverage differences.

Compare this resource with other directory records →
Compare two values without discarding quality flags
- Value
- Retain the unit, period and dimensions.
- Status flag
- Read qualifications attached to the observation.
- Choose the same indicator, unit and period for both countries.
- Keep flags with values: p means provisional and b a break in series.
- Distinguish “:” (unavailable), a real zero and “0n” (less than half the unit used).
Fictional example: A shows 120 with p and B shows “:”. B does not equal zero: a ranking and difference calculation are not established. A’s value retains its provisional status.
Your useful record: Dataset code, dimensions, units, values, status flags and download date.
A break in series requires reading the methodology before comparing periods.
Editorial method informed by Eurostat — Database and data flags. Documentation consulted on . Examples are fictional exercises, not results from a live service test.
Choose between raw and seasonally adjusted series
Recurring seasonal movements can obscure the trend in an economic time series.
| Element | Meaning |
|---|---|
| Raw series | Retains observed seasonal effects. |
| Seasonal adjustment | Seeks to remove recurring seasonal influences. |
| Comparison | Use the same treatment for both periods. |
| Routine revision | New information enters regular production; the value for an earlier period can change. |
| Major revision | A planned change in sources or methods, announced to users. |
| Unscheduled revision | May correct an error; read the explanation rather than inferring a real-world change. |
| Dataset metadata | Read “Data revision – policy” and “Data revision – practice”; keep the series code, selection and access date. |
Try the reasoning
Illustrative situation. Tourism rises every summer. Does that establish a lasting acceleration?
Read the explanation
No. Examine the series and its treatment. An expected seasonal rise and non-seasonal change answer different questions.
Documentation for the table : Eurostat — Seasonal adjustment · Eurostat — Data revision policy · . The exercise is an editorial example.
Read flags alongside values
The documentation separates observation status and confidentiality status. Keep flags attached to values: a provisional observation or series break needs its qualification.
- b
- Break in the time series.
- p
- Provisional value.
- : and 0
- The symbol : means unavailable; 0 represents a real zero.
- Method
- Also inspect units, dimensions and metadata.
- Zero and small value
- “0” represents a real zero; “0n” a value smaller than half the unit used. “:” means unavailable. These three states are not interchangeable.
- Series treatment
- For short-term business statistics, Eurostat distinguishes unadjusted, calendar-adjusted and seasonally adjusted data. Keep this dimension in an export: the selected treatment identifies the series just as its unit does.
- Match dimensions
- Before a monthly comparison, check frequency, unit, area and adjustment in both selections. A chart screenshot can hide a filtered dimension; retain the full selection and the metadata explaining its treatment.
- Dimension selection
- A dropdown may show only preselected options. “Customise your dataset” reveals all available dimensions and positions: check the unit, frequency and geographical aggregate in particular.
Source: Eurostat — Customise the data selection · consulted on - Fixed or moving period
- “Static positions” retains selected positions. “Fixed time” retains a number of recent periods and adapts as periods are added. Record actual years, rather than only “last ten years”, to reproduce a comparison.
Source: Eurostat — Customise the data selection · consulted on
Initial profile documentation
- Eurostat — Database, legends and flags ↗
- Eurostat — Statistiques conjoncturelles, traitements des données ↗
Initial profile documentation consulted on . Added details carry their own source and consultation date above.
Editorial selection, without website certification. Read our method.