

Banque mondiale
Data, projects, research and analysis on economic and social development worldwide.
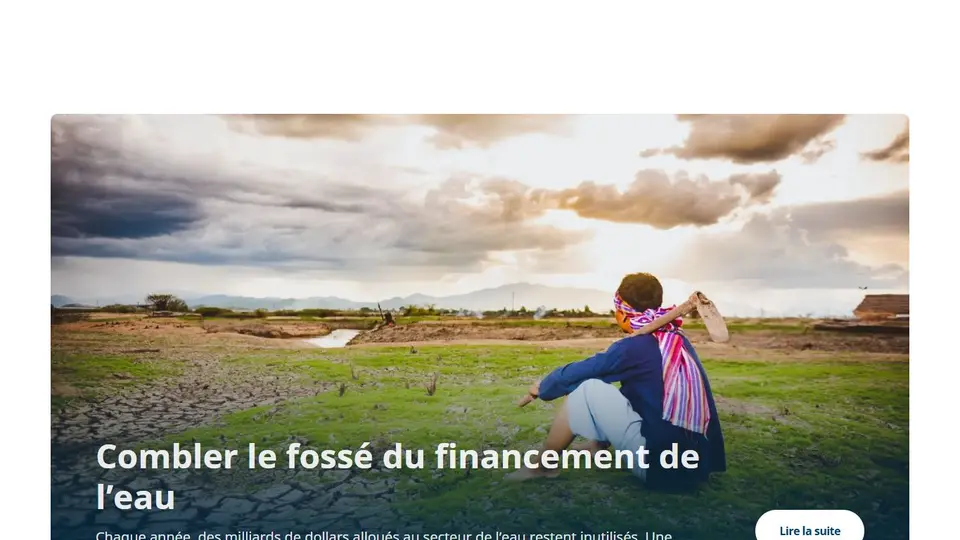
Screenshot captured on an unrecorded date. The current website may have changed.
Explore a global indicator
Locate development data series and documentation.
Check first: Read definitions, country coverage and missing values.

Compare this resource with other directory records →
Separate current and constant prices
Current-price series use each year’s prices; constant-price series use a reference year.
| Element | Meaning |
|---|---|
| Current prices | Changes may include a price effect. |
| Constant prices | Read changes in volume. |
| Comparison | Retain unit, currency and reference year. |
| Reference year | It fixes the prices used for all observations in a constant-price series, rather than the observation year. |
| Dollar conversion | Exchange-rate changes can affect comparisons between current and constant series expressed in dollars. |
Try the reasoning
Illustrative situation. A fictional value rises from 100 to 110 while the price index rises from 100 to 105. What is the volume change?
Read the explanation
110 ÷ 1.05 = 104.76: about +4.76% under these simplified assumptions. The nominal 10% rise is not the volume rise.
Documentation for the table : World Bank — Current and constant price series · . The exercise is an editorial example.
Compare an indicator, not just two countries
The World Bank data portal supports exploration of indicators and territories. Before comparing, record the indicator definition, unit and available years. A missing year is not a zero value.
- Indicator
- Retain name, definition and unit.
- Period
- Compare consistent years and record missing data.
- Traceability
- Keep the source and table download date.
- Choose the platform
- The homepage distinguishes DataBank time series, Microdata Library surveys, Data Catalog datasets and the Data360 expansion.
- Latest non-empty value
- The API distinguishes recent values from the latest non-empty values. A selection using the latest available observation can therefore return different years for different countries. Keep the year with each value before building a ranking.
- Observation notes
- The footnote=y parameter requests notes associated with an observation where available. For analysis, retain indicator code, country, year, notes and selection parameters; a shared chart title does not document these choices.
- Indicator code
- An indicator record exposes its identifier, name, source and definition. Keep the full code alongside a translated label to find the same series again.
Source: World Bank — Indicator API queries · consulted on - Source and definition
- sourceNote describes the indicator and sourceOrganization identifies the data source. An empty unit field does not justify inventing a unit: read the series name and definition.
Source: World Bank — Indicator API queries · consulted on
Can I compare figures from different dates without mentioning it?
State the years and limitations; first look for a common period.
Where should I look for observations rather than a chart?
Choose the platform for the data type, then retain dataset, indicator, period and downloaded file. A presentation chart does not replace definitions.
Initial profile documentation
- Comparer un indicateur, pas seulement deux pays / Compare an indicator, not just two countries ↗
- Banque mondiale — Paramètres de l’API des indicateurs ↗
Initial profile documentation consulted on . Added details carry their own source and consultation date above.
Editorial selection, without website certification. Read our method.