
Our World in Data
Documented data and charts on health, environment, economics and global issues.
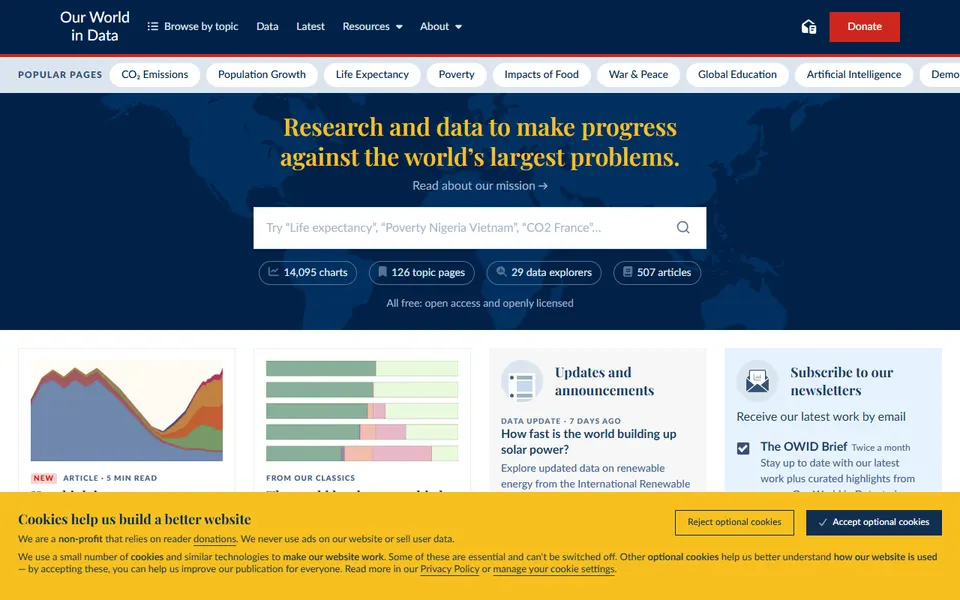
Screenshot captured on 2026-09-22. The current website may have changed.
Cite a global chart
Open the dataset, indicator definition and visualisation settings before export.
Check first: Retain units, coverage, missing values and update date; a curve alone does not prove causality.

Compare this resource with other directory records →
Separate the chart reference from the data reference
- OWID chart
- Present a comparison.
- Underlying data
- Identify provider and citation.
- Open the indicator information beneath the chart.
- Identify the provider and reuse conditions.
- Keep references for both chart and data used.
Fictional example: a teacher prepares a slide and calculation table from one chart. The slide retains its visual reference; the values retain the provider’s reference. The table specifies the chosen unit and period.
Your useful record: Indicator, unit, period, provider and both references when needed.
An OWID chart licence does not describe all third-party data.
Editorial method informed by Our World in Data — FAQs and user guidelines. Documentation consulted on . Examples are fictional exercises, not results from a live service test.
Recover the definition behind a chart
Our World in Data links articles and charts to sources and data definitions. Open indicator information before sharing a comparison: unit, coverage, period and producer. Also retain transformations such as per-person values or a logarithmic scale.
- Resources
- Articles, charts and associated data.
- Metadata
- Indicator definition, origin and processing.
- Reuse
- Check conditions for the specific data and content used.
- Indicator citation
- Learn more about this data provides data citation instructions.
Source: Our World in Data — FAQs and user guidelines · consulted on - Third-party providers
- Their licence terms still apply to data distributed by Our World in Data.
Source: Our World in Data — FAQs and user guidelines · consulted on
Are two plotted curves immediately comparable?
Check definitions, units and covered periods before drawing conclusions.
Which source should I cite?
Keep the chart page and documentation together with the stated data producer.
Initial profile documentation
Initial profile documentation consulted on . Added details carry their own source and consultation date above.
Editorial selection, without website certification. Read our method.